


Plainfield township, Will County, Illinois
About
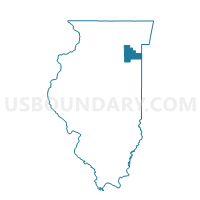
Outline

Summary
| Unique Area Identifier | 126326 |
| Name | Plainfield township |
| County | Will County |
| State | Illinois |
| Area (square miles) | 35.24 |
| Land Area (square miles) | 33.48 |
| Water Area (square miles) | 1.76 |
| % of Land Area | 95.01 |
| % of Water Area | 4.99 |
| Latitude of the Internal Point | 41.59380550 |
| Longtitude of the Internal Point | -88.19967510 |
| Total Population | 80,318 |
| Total Housing Units | 25,333 |
| Total Households | 24,276 |
| Median Age | 32.5 |
Maps


Graphs
Select a template below for downloading or customizing gragh for Plainfield township, Will County, Illinois


Neighbors
Neighoring County Subdivision (by Name) Neighboring County Subdivision on the Map
- Du Page township, Will County, IL
- Joliet township, Will County, IL
- Lockport township, Will County, IL
- Na-Au-Say township, Kendall County, IL
- Oswego township, Kendall County, IL
- Seward township, Kendall County, IL
- Troy township, Will County, IL
- Wheatland township, Will County, IL
Top 10 Neighboring Place (by Population) Neighboring Place on the Map
- Joliet city, IL (147,433)
- Bolingbrook village, IL (73,366)
- Romeoville village, IL (39,680)
- Plainfield village, IL (39,581)
- Crest Hill city, IL (20,837)
- Crystal Lawns CDP, IL (1,872)
Top 10 Neighboring Elementary School District (by Population) Neighboring Elementary School District on the Map
- Joliet Public School District 86, IL (84,281)
- Troy Community Consolidated School District 30C, IL (36,786)
- Minooka Community Consolidated School District 201, IL (23,634)
- Richland School District 88A, IL (10,030)
Top 10 Neighboring Secondary School District (by Population) Neighboring Secondary School District on the Map
- Joliet Township High School District 204, IL (128,595)
- Lockport Township High School District 205, IL (75,869)
- Minooka Community High School District 111, IL (38,032)
Top 10 Neighboring Unified School District (by Population) Neighboring Unified School District on the Map
- Plainfield School District 202, IL (120,091)
- Valley View Community Unit School District 365U, IL (92,516)
- Oswego Community Unit School District 308, IL (75,151)
Top 10 Neighboring State Legislative District Lower Chamber (by Population) Neighboring State Legislative District Lower Chamber on the Map
- State House District 84, IL (202,008)
- State House District 50, IL (178,899)
- State House District 85, IL (139,496)
- State House District 86, IL (113,396)
Top 10 Neighboring State Legislative District Upper Chamber (by Population) Neighboring State Legislative District Upper Chamber on the Map
- State Senate District 42, IL (337,625)
- State Senate District 25, IL (332,979)
- State Senate District 43, IL (252,892)
Top 10 Neighboring 111th Congressional District (by Population) Neighboring 111th Congressional District on the Map
- Congressional District 14, IL (840,956)
- Congressional District 13, IL (773,095)
- Congressional District 11, IL (759,445)
Top 10 Neighboring Census Tract (by Population) Neighboring Census Tract on the Map
- Census Tract 8901.01, Kendall County, IL (18,051)
- Census Tract 8907, Kendall County, IL (15,257)
- Census Tract 8803.10, Will County, IL (11,485)
- Census Tract 8804.04, Will County, IL (11,036)
- Census Tract 8804.20, Will County, IL (10,373)
- Census Tract 8832.15, Will County, IL (10,210)
- Census Tract 8804.19, Will County, IL (8,983)
- Census Tract 8804.10, Will County, IL (8,609)
- Census Tract 8803.08, Will County, IL (8,019)
- Census Tract 8804.15, Will County, IL (7,311)
Top 10 Neighboring 5-Digit ZIP Code Tabulation Area (by Population) Neighboring 5-Digit ZIP Code Tabulation Area on the Map
- 60435, IL (48,899)
- 60586, IL (46,251)
- 60446, IL (39,807)
- 60441, IL (36,869)
- 60544, IL (25,959)
- 60431, IL (22,577)
- 60585, IL (22,311)
- 60490, IL (20,463)
- 60403, IL (17,529)
- 60404, IL (17,395)
Data
Demographic, Population, Households, and Housing Units
** Data sources from census 2010 **
Show Data on Map
Download Full List as CSV
Download Quick Sheet as CSV
| Subject | This Area | Will County | Illinois | National |
|---|---|---|---|---|
| POPULATION | ||||
| Total Population Map | 80,318 | 677,560 | 12,830,632 | 308,745,538 |
| POPULATION, HISPANIC OR LATINO ORIGIN | ||||
| Not Hispanic or Latino Map | 64,762 | 571,743 | 10,803,054 | 258,267,944 |
| Hispanic or Latino Map | 15,556 | 105,817 | 2,027,578 | 50,477,594 |
| POPULATION, RACE | ||||
| White alone Map | 63,560 | 514,664 | 9,177,877 | 223,553,265 |
| Black or African American alone Map | 5,518 | 75,743 | 1,866,414 | 38,929,319 |
| American Indian and Alaska Native alone Map | 278 | 1,703 | 43,963 | 2,932,248 |
| Asian alone Map | 3,363 | 30,833 | 586,934 | 14,674,252 |
| Native Hawaiian and Other Pacific Islander alone Map | 11 | 136 | 4,050 | 540,013 |
| Some Other Race alone Map | 5,472 | 39,025 | 861,412 | 19,107,368 |
| Two or More Races Map | 2,116 | 15,456 | 289,982 | 9,009,073 |
| POPULATION, SEX | ||||
| Male Map | 39,935 | 336,556 | 6,292,276 | 151,781,326 |
| Female Map | 40,383 | 341,004 | 6,538,356 | 156,964,212 |
| POPULATION, AGE (18 YEARS) | ||||
| 18 years and over Map | 53,352 | 480,606 | 9,701,453 | 234,564,071 |
| Under 18 years | 26,966 | 196,954 | 3,129,179 | 74,181,467 |
| POPULATION, AGE | ||||
| Under 5 years | 6,391 | 49,045 | 835,577 | 20,201,362 |
| 5 to 9 years | 7,878 | 56,056 | 859,405 | 20,348,657 |
| 10 to 14 years | 8,109 | 57,446 | 879,448 | 20,677,194 |
| 15 to 17 years | 4,588 | 34,407 | 554,749 | 12,954,254 |
| 18 and 19 years | 2,323 | 18,178 | 367,343 | 9,086,089 |
| 20 years | 903 | 7,767 | 179,613 | 4,519,129 |
| 21 years | 763 | 7,165 | 172,795 | 4,354,294 |
| 22 to 24 years | 2,226 | 21,475 | 526,556 | 12,712,576 |
| 25 to 29 years | 4,218 | 38,482 | 910,273 | 21,101,849 |
| 30 to 34 years | 5,801 | 44,481 | 865,684 | 19,962,099 |
| 35 to 39 years | 7,847 | 52,400 | 855,790 | 20,179,642 |
| 40 to 44 years | 7,732 | 55,715 | 870,100 | 20,890,964 |
| 45 to 49 years | 6,424 | 54,969 | 940,094 | 22,708,591 |
| 50 to 54 years | 4,737 | 48,183 | 930,785 | 22,298,125 |
| 55 to 59 years | 3,364 | 38,111 | 807,778 | 19,664,805 |
| 60 and 61 years | 1,086 | 13,079 | 284,180 | 7,113,727 |
| 62 to 64 years | 1,460 | 17,787 | 381,249 | 9,704,197 |
| 65 and 66 years | 706 | 9,269 | 205,270 | 5,319,902 |
| 67 to 69 years | 937 | 12,210 | 279,790 | 7,115,361 |
| 70 to 74 years | 1,052 | 14,939 | 364,475 | 9,278,166 |
| 75 to 79 years | 735 | 10,822 | 289,385 | 7,317,795 |
| 80 to 84 years | 553 | 8,072 | 235,381 | 5,743,327 |
| 85 years and over | 485 | 7,502 | 234,912 | 5,493,433 |
| MEDIAN AGE BY SEX | ||||
| Both sexes Map | 32.50 | 35.40 | 36.60 | 37.20 |
| Male Map | 31.80 | 34.50 | 35.20 | 35.80 |
| Female Map | 33.20 | 36.30 | 37.90 | 38.50 |
| HOUSEHOLDS | ||||
| Total Households Map | 24,276 | 225,256 | 4,836,972 | 116,716,292 |
| HOUSEHOLDS, HOUSEHOLD TYPE | ||||
| Family households: Map | 20,302 | 174,062 | 3,182,984 | 77,538,296 |
| Husband-wife family Map | 16,862 | 139,545 | 2,332,995 | 56,510,377 |
| Other family: Map | 3,440 | 34,517 | 849,989 | 21,027,919 |
| Male householder, no wife present Map | 1,098 | 10,043 | 227,684 | 5,777,570 |
| Female householder, no husband present Map | 2,342 | 24,474 | 622,305 | 15,250,349 |
| Nonfamily households: Map | 3,974 | 51,194 | 1,653,988 | 39,177,996 |
| Householder living alone Map | 3,079 | 41,779 | 1,346,312 | 31,204,909 |
| Householder not living alone Map | 895 | 9,415 | 307,676 | 7,973,087 |
| HOUSEHOLDS, HISPANIC OR LATINO ORIGIN OF HOUSEHOLDER | ||||
| Not Hispanic or Latino householder: Map | 20,844 | 201,131 | 4,329,737 | 103,254,926 |
| Hispanic or Latino householder: Map | 3,432 | 24,125 | 507,235 | 13,461,366 |
| HOUSEHOLDS, RACE OF HOUSEHOLDER | ||||
| Householder who is White alone | 20,235 | 180,351 | 3,680,912 | 89,754,352 |
| Householder who is Black or African American alone | 1,562 | 24,302 | 668,152 | 14,129,983 |
| Householder who is American Indian and Alaska Native alone | 65 | 485 | 13,449 | 939,707 |
| Householder who is Asian alone | 828 | 8,265 | 192,603 | 4,632,164 |
| Householder who is Native Hawaiian and Other Pacific Islander alone | 2 | 36 | 1,278 | 143,932 |
| Householder who is Some Other Race alone | 1,251 | 9,141 | 213,509 | 4,916,427 |
| Householder who is Two or More Races | 333 | 2,676 | 67,069 | 2,199,727 |
| HOUSEHOLDS, HOUSEHOLD TYPE BY HOUSEHOLD SIZE | ||||
| Family households: Map | 20,302 | 174,062 | 3,182,984 | 77,538,296 |
| 2-person household Map | 5,111 | 56,303 | 1,259,669 | 31,882,616 |
| 3-person household Map | 4,351 | 38,441 | 720,213 | 17,765,829 |
| 4-person household Map | 5,663 | 42,599 | 644,972 | 15,214,075 |
| 5-person household Map | 3,191 | 22,577 | 326,688 | 7,411,997 |
| 6-person household Map | 1,264 | 8,762 | 132,759 | 3,026,278 |
| 7-or-more-person household Map | 722 | 5,380 | 98,683 | 2,237,501 |
| Nonfamily households: Map | 3,974 | 51,194 | 1,653,988 | 39,177,996 |
| 1-person household Map | 3,079 | 41,779 | 1,346,312 | 31,204,909 |
| 2-person household Map | 754 | 7,878 | 250,239 | 6,360,012 |
| 3-person household Map | 84 | 908 | 36,254 | 992,156 |
| 4-person household Map | 28 | 368 | 14,759 | 411,171 |
| 5-person household Map | 13 | 126 | 3,959 | 126,634 |
| 6-person household Map | 5 | 81 | 1,433 | 48,421 |
| 7-or-more-person household Map | 11 | 54 | 1,032 | 34,693 |
| HOUSING UNITS | ||||
| Total Housing Units Map | 25,333 | 237,501 | 5,296,715 | 131,704,730 |
| HOUSING UNITS, OCCUPANCY STATUS | ||||
| Occupied Map | 24,276 | 225,256 | 4,836,972 | 116,716,292 |
| Vacant Map | 1,057 | 12,245 | 459,743 | 14,988,438 |
| HOUSING UNITS, OCCUPIED, TENURE | ||||
| Owned with a mortgage or a loan Map | 19,858 | 153,193 | 2,338,493 | 52,979,430 |
| Owned free and clear Map | 2,231 | 34,232 | 925,146 | 23,006,644 |
| Renter occupied Map | 2,187 | 37,831 | 1,573,333 | 40,730,218 |
| HOUSING UNITS, VACANT, VACANCY STATUS | ||||
| For rent Map | 205 | 3,037 | 158,882 | 4,137,567 |
| Rented, not occupied Map | 2 | 145 | 7,998 | 206,825 |
| For sale only Map | 363 | 3,713 | 82,739 | 1,896,796 |
| Sold, not occupied Map | 51 | 517 | 16,677 | 421,032 |
| For seasonal, recreational, or occasional use Map | 46 | 1,206 | 47,289 | 4,649,298 |
| For migrant workers Map | 0 | 8 | 315 | 24,161 |
| Other vacant Map | 390 | 3,619 | 145,843 | 3,652,759 |
| HOUSING UNITS, OCCUPIED, AVERAGE HOUSEHOLD SIZE BY TENURE | ||||
| Total: Map | 3.30 | 2.97 | 2.59 | 2.58 |
| Owner occupied Map | 3.32 | 3.04 | 2.69 | 2.65 |
| Renter occupied Map | 3.14 | 2.65 | 2.38 | 2.44 |
| HOUSING UNITS, OCCUPIED, TENURE BY RACE OF HOUSEHOLDER | ||||
| Owner occupied: Map | 22,089 | 187,425 | 3,263,639 | 75,986,074 |
| Householder who is White alone Map | 18,612 | 157,268 | 2,728,000 | 63,446,275 |
| Householder who is Black or African American alone Map | 1,231 | 13,631 | 272,489 | 6,261,464 |
| Householder who is American Indian and Alaska Native alone Map | 56 | 365 | 6,873 | 509,588 |
| Householder who is Asian alone Map | 788 | 7,545 | 118,649 | 2,688,861 |
| Householder who is Native Hawaiian and Other Pacific Islander alone Map | 2 | 30 | 644 | 61,911 |
| Householder who is Some Other Race alone Map | 1,119 | 6,610 | 103,641 | 1,975,817 |
| Householder who is Two or More Races Map | 281 | 1,976 | 33,343 | 1,042,158 |
| Renter occupied: Map | 2,187 | 37,831 | 1,573,333 | 40,730,218 |
| Householder who is White alone Map | 1,623 | 23,083 | 952,912 | 26,308,077 |
| Householder who is Black or African American alone Map | 331 | 10,671 | 395,663 | 7,868,519 |
| Householder who is American Indian and Alaska Native alone Map | 9 | 120 | 6,576 | 430,119 |
| Householder who is Asian alone Map | 40 | 720 | 73,954 | 1,943,303 |
| Householder who is Native Hawaiian and Other Pacific Islander alone Map | 0 | 6 | 634 | 82,021 |
| Householder who is Some Other Race alone Map | 132 | 2,531 | 109,868 | 2,940,610 |
| Householder who is Two or More Races Map | 52 | 700 | 33,726 | 1,157,569 |
| HOUSING UNITS, OCCUPIED, TENURE BY HISPANIC OR LATINO ORIGIN OF HOUSEHOLDER | ||||
| Owner occupied: Map | 22,089 | 187,425 | 3,263,639 | 75,986,074 |
| Not Hispanic or Latino householder Map | 18,985 | 169,187 | 2,996,581 | 69,617,625 |
| Hispanic or Latino householder Map | 3,104 | 18,238 | 267,058 | 6,368,449 |
| Renter occupied: Map | 2,187 | 37,831 | 1,573,333 | 40,730,218 |
| Not Hispanic or Latino householder Map | 1,859 | 31,944 | 1,333,156 | 33,637,301 |
| Hispanic or Latino householder Map | 328 | 5,887 | 240,177 | 7,092,917 |
| HOUSING UNITS, OCCUPIED, TENURE BY HOUSEHOLD SIZE | ||||
| Owner occupied: Map | 22,089 | 187,425 | 3,263,639 | 75,986,074 |
| 1-person household Map | 2,595 | 29,048 | 732,688 | 16,453,569 |
| 2-person household Map | 5,443 | 55,599 | 1,111,442 | 27,618,605 |
| 3-person household Map | 4,023 | 33,364 | 529,763 | 12,517,563 |
| 4-person household Map | 5,292 | 37,988 | 493,300 | 10,998,793 |
| 5-person household Map | 2,946 | 19,720 | 238,851 | 5,057,765 |
| 6-person household Map | 1,145 | 7,373 | 92,193 | 1,965,796 |
| 7-or-more-person household Map | 645 | 4,333 | 65,402 | 1,373,983 |
| Renter occupied: Map | 2,187 | 37,831 | 1,573,333 | 40,730,218 |
| 1-person household Map | 484 | 12,731 | 613,624 | 14,751,340 |
| 2-person household Map | 422 | 8,582 | 398,466 | 10,624,023 |
| 3-person household Map | 412 | 5,985 | 226,704 | 6,240,422 |
| 4-person household Map | 399 | 4,979 | 166,431 | 4,626,453 |
| 5-person household Map | 258 | 2,983 | 91,796 | 2,480,866 |
| 6-person household Map | 124 | 1,470 | 41,999 | 1,108,903 |
| 7-or-more-person household Map | 88 | 1,101 | 34,313 | 898,211 |
Loading...